

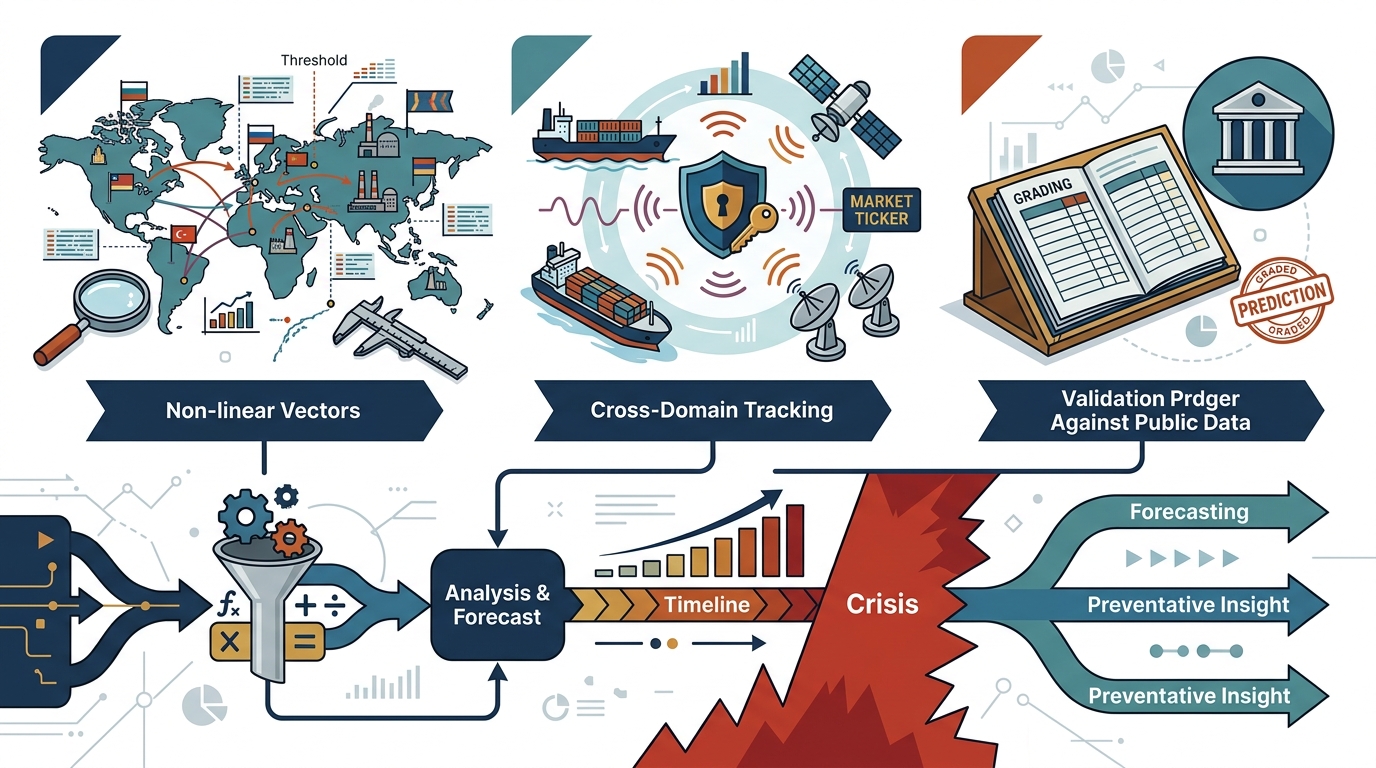
Analysts forecast gray-zone escalation by mapping threshold triggers, tracking cross-domain signals, and grading predictions against public records. This guide explains the methodology used by CRUCIBEL Journal to identify systemic risks before they become crises.
Escalation Threshold Mapping
Escalation threshold mapping is the process of identifying specific conditions that trigger a shift from stable competition to active conflict. Analysts define these thresholds by examining historical precedents and current structural vulnerabilities. The goal is to move beyond vague warnings and establish concrete, observable indicators.
Defining the Gray Zone
The gray zone is the space between peace and open war where states use non-kinetic tools to achieve strategic objectives. It includes economic coercion, cyber operations, and information warfare. Because these actions fall below the threshold of conventional war, they are often overlooked by traditional defense planning.
Identifying Tripwires
Analysts identify tripwires by looking for points of no return in diplomatic or economic relationships. For example, the automatic termination of marine war risk insurance upon the outbreak of war between specific great powers serves as a hard structural limit. When commercial entities withdraw, the economic foundation of a conflict collapses, signaling a critical threshold.
Structural vs. Behavioral Triggers
Some thresholds are structural, such as the physical limits of supply chains or the legal frameworks of international trade. Others are behavioral, such as a shift in public opinion or a change in leadership rhetoric. Effective mapping requires tracking both types simultaneously to understand the full picture of escalation risk.
Cross-Domain Signal Detection
Cross-domain signal detection is the practice of analyzing data from multiple unrelated fields to identify patterns that single-domain analysts miss. CRUCIBEL Journal applies this method by tracking convergence across defense, markets, and science. This approach reveals systemic risks that are invisible within isolated silos.
The Convergence Framework
The convergence framework identifies the point where independent trends begin to move toward intersection. It involves monitoring energy markets, maritime chokepoints, and technological supply chains simultaneously. When these domains start to interact in unexpected ways, it signals a potential cascade of systemic failure.
Using Open-Source Intelligence
Statistical Validation
Statistical validation is the process of testing whether observed patterns are real or coincidental. CRUCIBEL uses nonparametric inferential testing to determine the significance of cross-domain convergence. This rigorous approach ensures that the signals identified are not just noise but meaningful indicators of systemic change.
Grading Forecasts in Public
Grading forecasts in public is the discipline of publishing predictions and then evaluating their accuracy against actual events. This practice creates accountability and allows the analytical community to assess the reliability of different methodologies. It transforms forecasting from an art into a measurable science.
The Report Card Model
The report card model is a system for tracking the performance of individual predictions over time. Each forecast is assigned a grade based on how closely the outcome matched the prediction. This transparency helps readers understand the strengths and limitations of the analytical method.
Learning from Failures
Failures are as valuable as successes in the forecasting process. By publishing postmortems of failed predictions, analysts can identify blind spots in their methodology. This continuous feedback loop improves the accuracy of future forecasts and builds trust with the audience.
Building Institutional Memory
Public grading builds institutional memory by creating a permanent record of what was predicted and what actually happened. This archive serves as a valuable resource for future analysts and policymakers. It helps prevent the repetition of past mistakes and provides a baseline for measuring progress.
Key Takeaways
- Escalation threshold mapping identifies specific conditions that trigger conflict.
- Cross-domain signal detection reveals systemic risks invisible to single-domain analysts.
- The convergence framework tracks the intersection of independent trends.
- Open-source intelligence provides a comprehensive view of global risk.
- Statistical validation ensures that observed patterns are significant.
- Public grading creates accountability and improves forecasting accuracy.
- The report card model tracks the performance of individual predictions.
- Failures provide valuable lessons for improving analytical methodology.
Frequently Asked Questions
What is gray-zone escalation?
Gray-zone escalation is the process of increasing tension and conflict through non-kinetic means, such as economic pressure or cyber attacks, without crossing the threshold of open war.
How do analysts map escalation thresholds?
Analysts map escalation thresholds by identifying specific conditions, such as legal or economic limits, that trigger a shift from stable competition to active conflict.
What is cross-domain signal detection?
Cross-domain signal detection is the practice of analyzing data from multiple unrelated fields to identify patterns that indicate systemic risk.
Why is public grading important?
Public grading is important because it creates accountability and allows the analytical community to assess the reliability of different forecasting methodologies.
What is the convergence framework?
The convergence framework is a method for identifying the point where independent trends begin to move toward intersection, signaling a potential cascade of systemic failure.
How does CRUCIBEL use open-source intelligence?
CRUCIBEL uses open-source intelligence to track everything from shipping routes to semiconductor production, building a comprehensive picture of global risk.
What is statistical validation in forecasting?
Statistical validation is the process of testing whether observed patterns are real or coincidental, ensuring that the signals identified are meaningful indicators of systemic change.
How does the report card model work?
The report card model tracks the performance of individual predictions over time, assigning a grade based on how closely the outcome matched the prediction.
Conclusion
Forecasting gray-zone escalation requires a rigorous, multi-disciplinary approach that combines threshold mapping, cross-domain signal detection, and public accountability. CRUCIBEL Journal provides the tools and methodology for analysts to navigate this complex landscape. By applying these principles, you can identify systemic risks before they become crises. To explore our full library of convergence intelligence, visit the All Papers section of our site.